

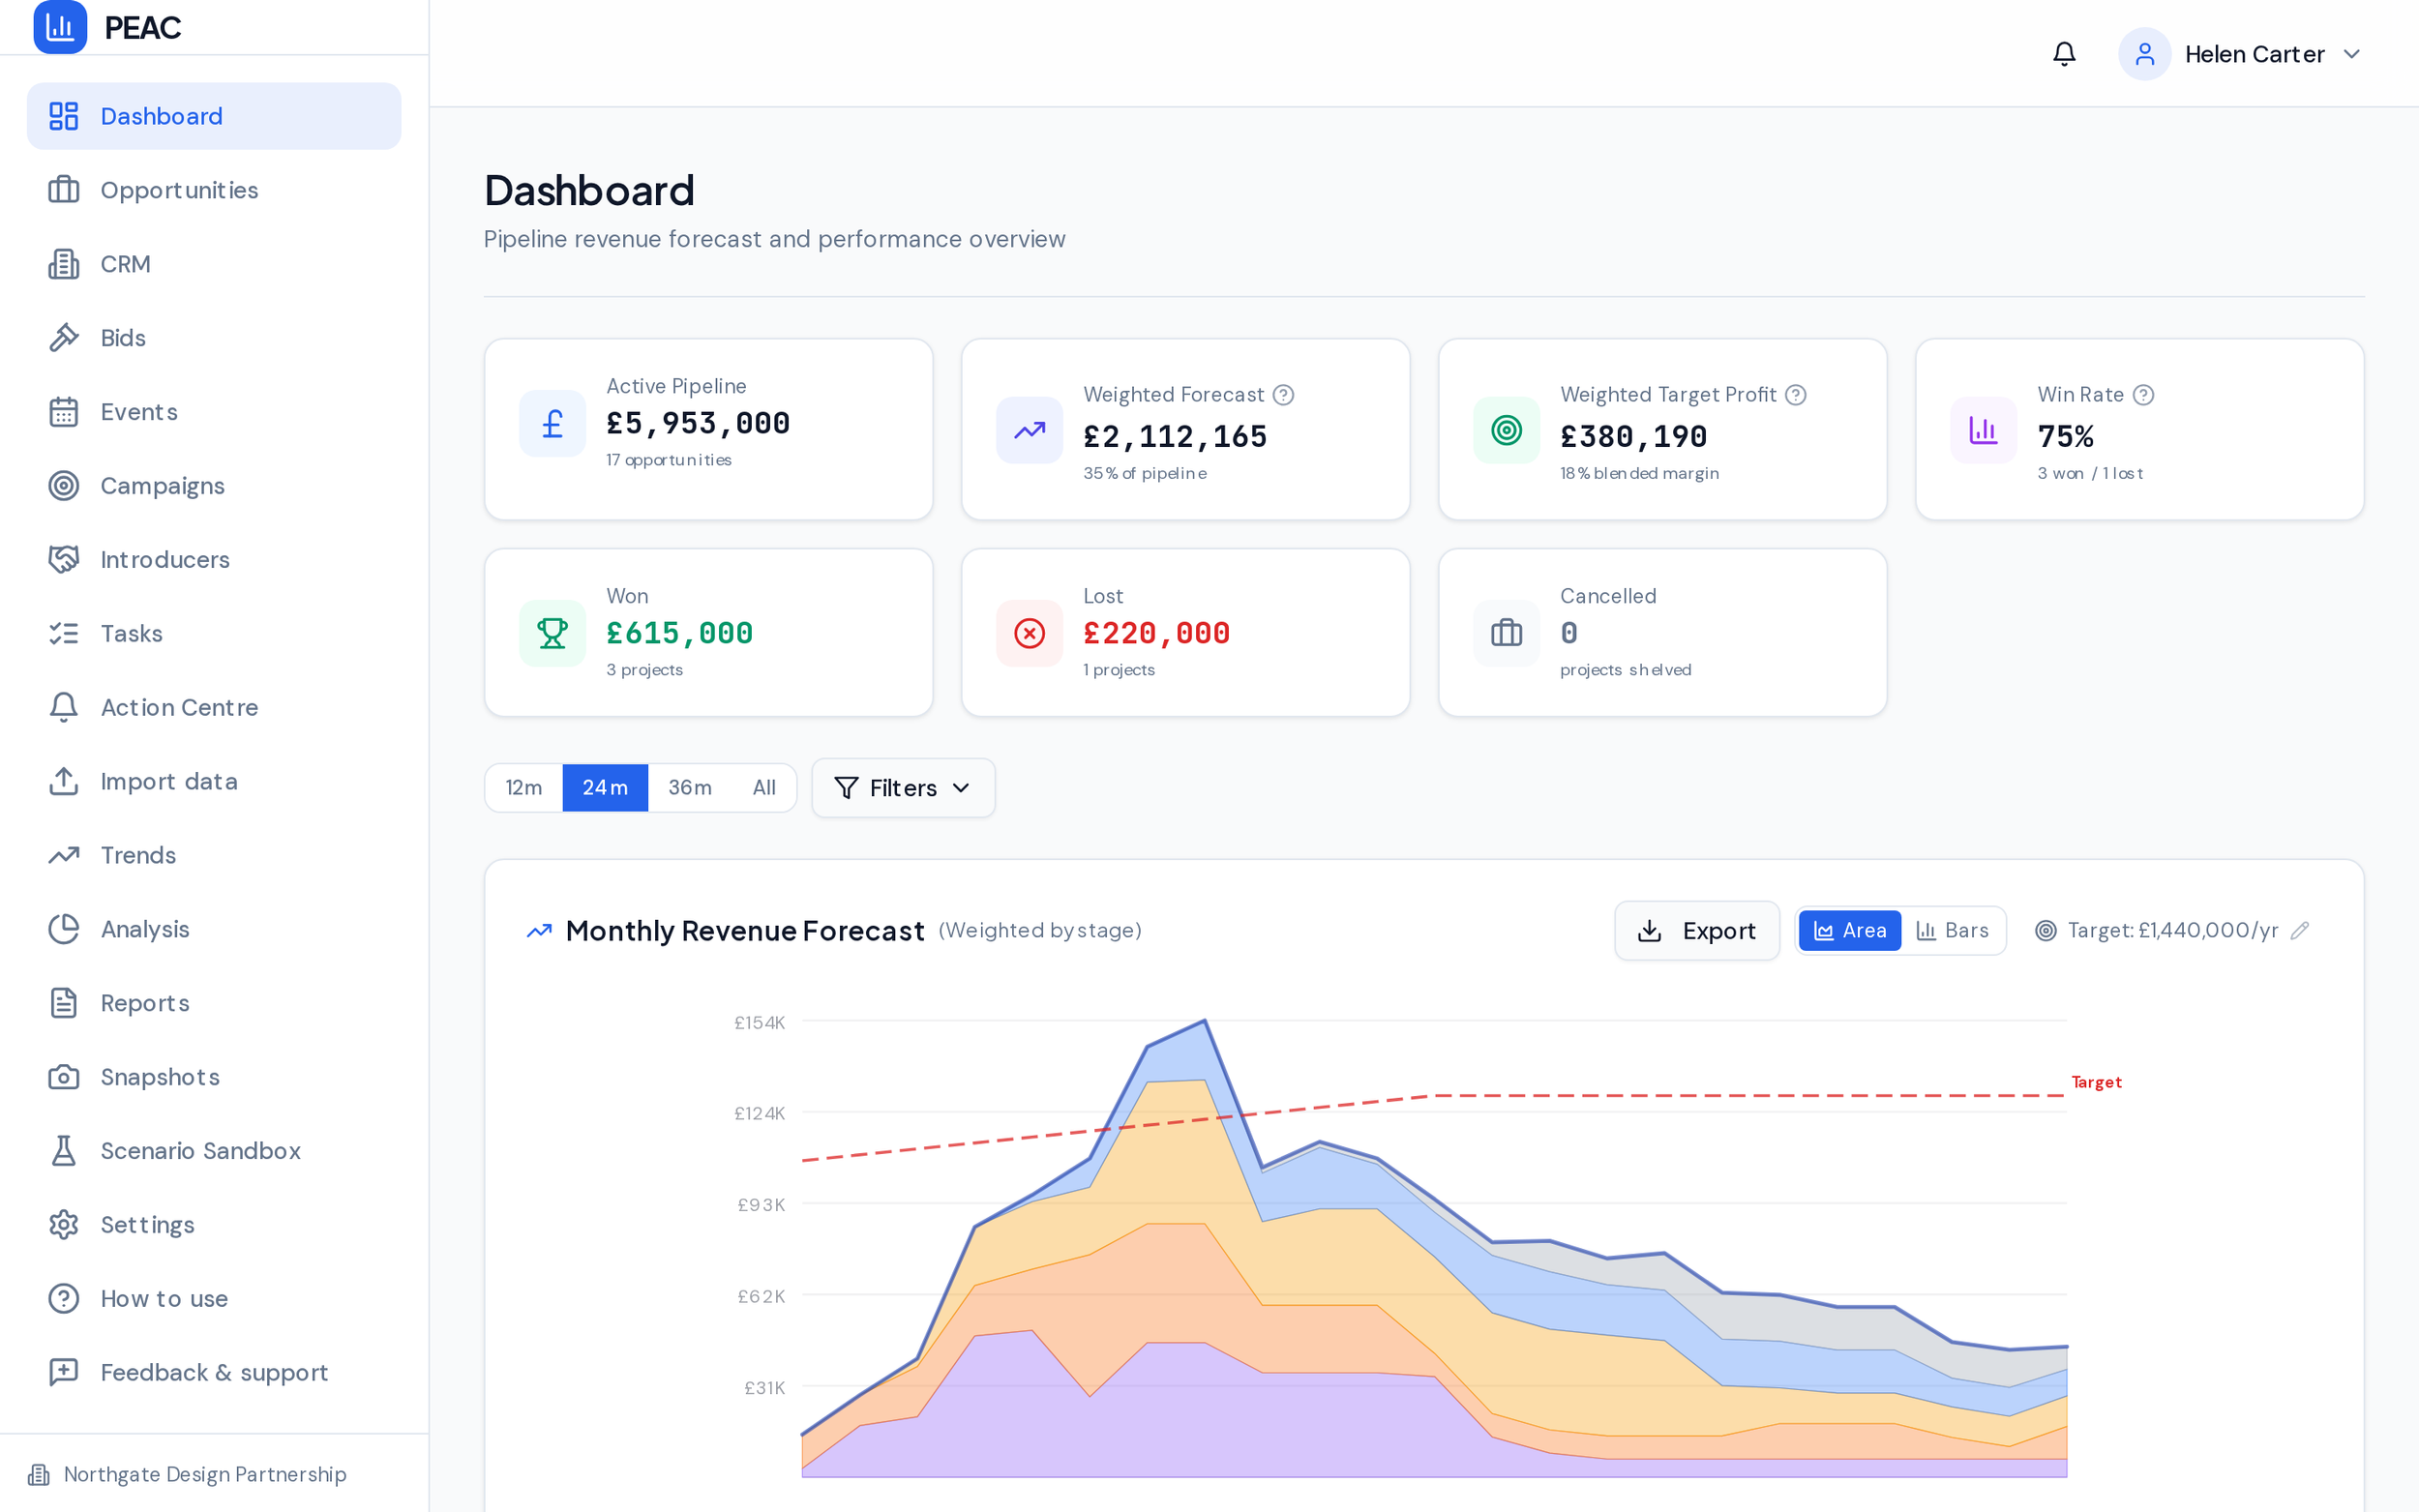
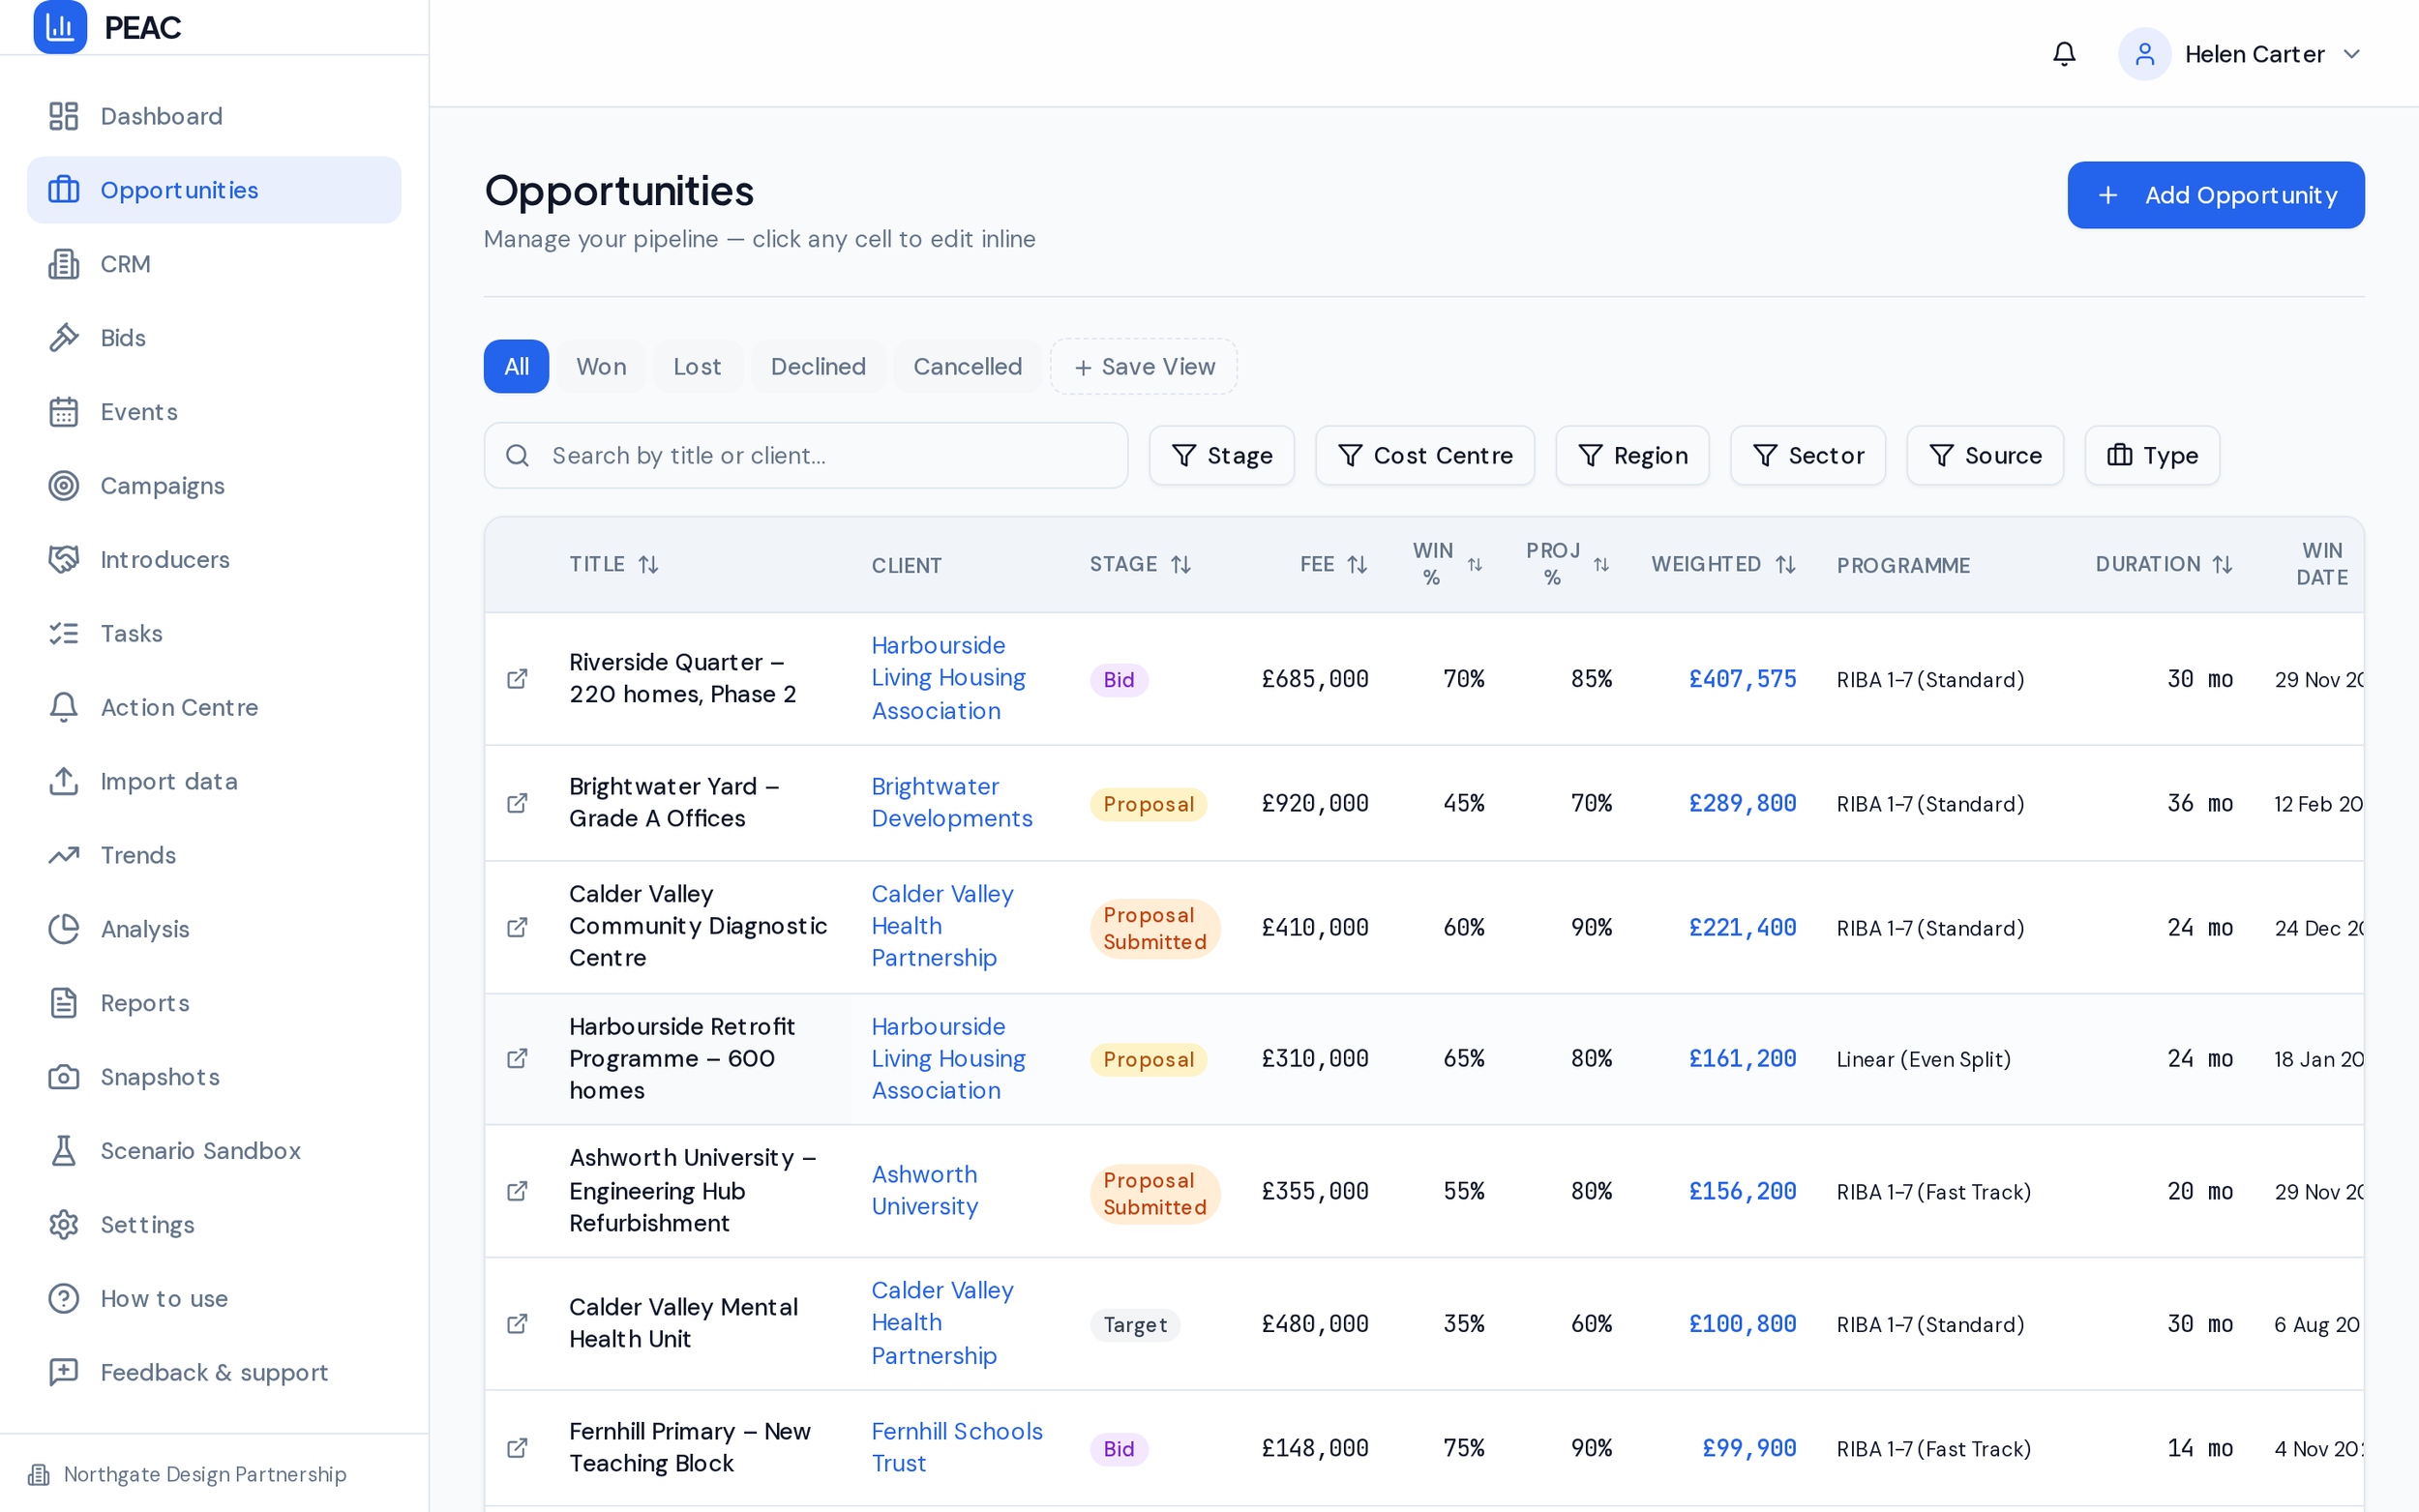
Track your targets, leads, opportunities, tenders, bids, submissions and accurately project your future fee income with confidence. No more spreadsheets showing blind forecasting, unknown resource headaches and endless board meetings reviewing line by line.
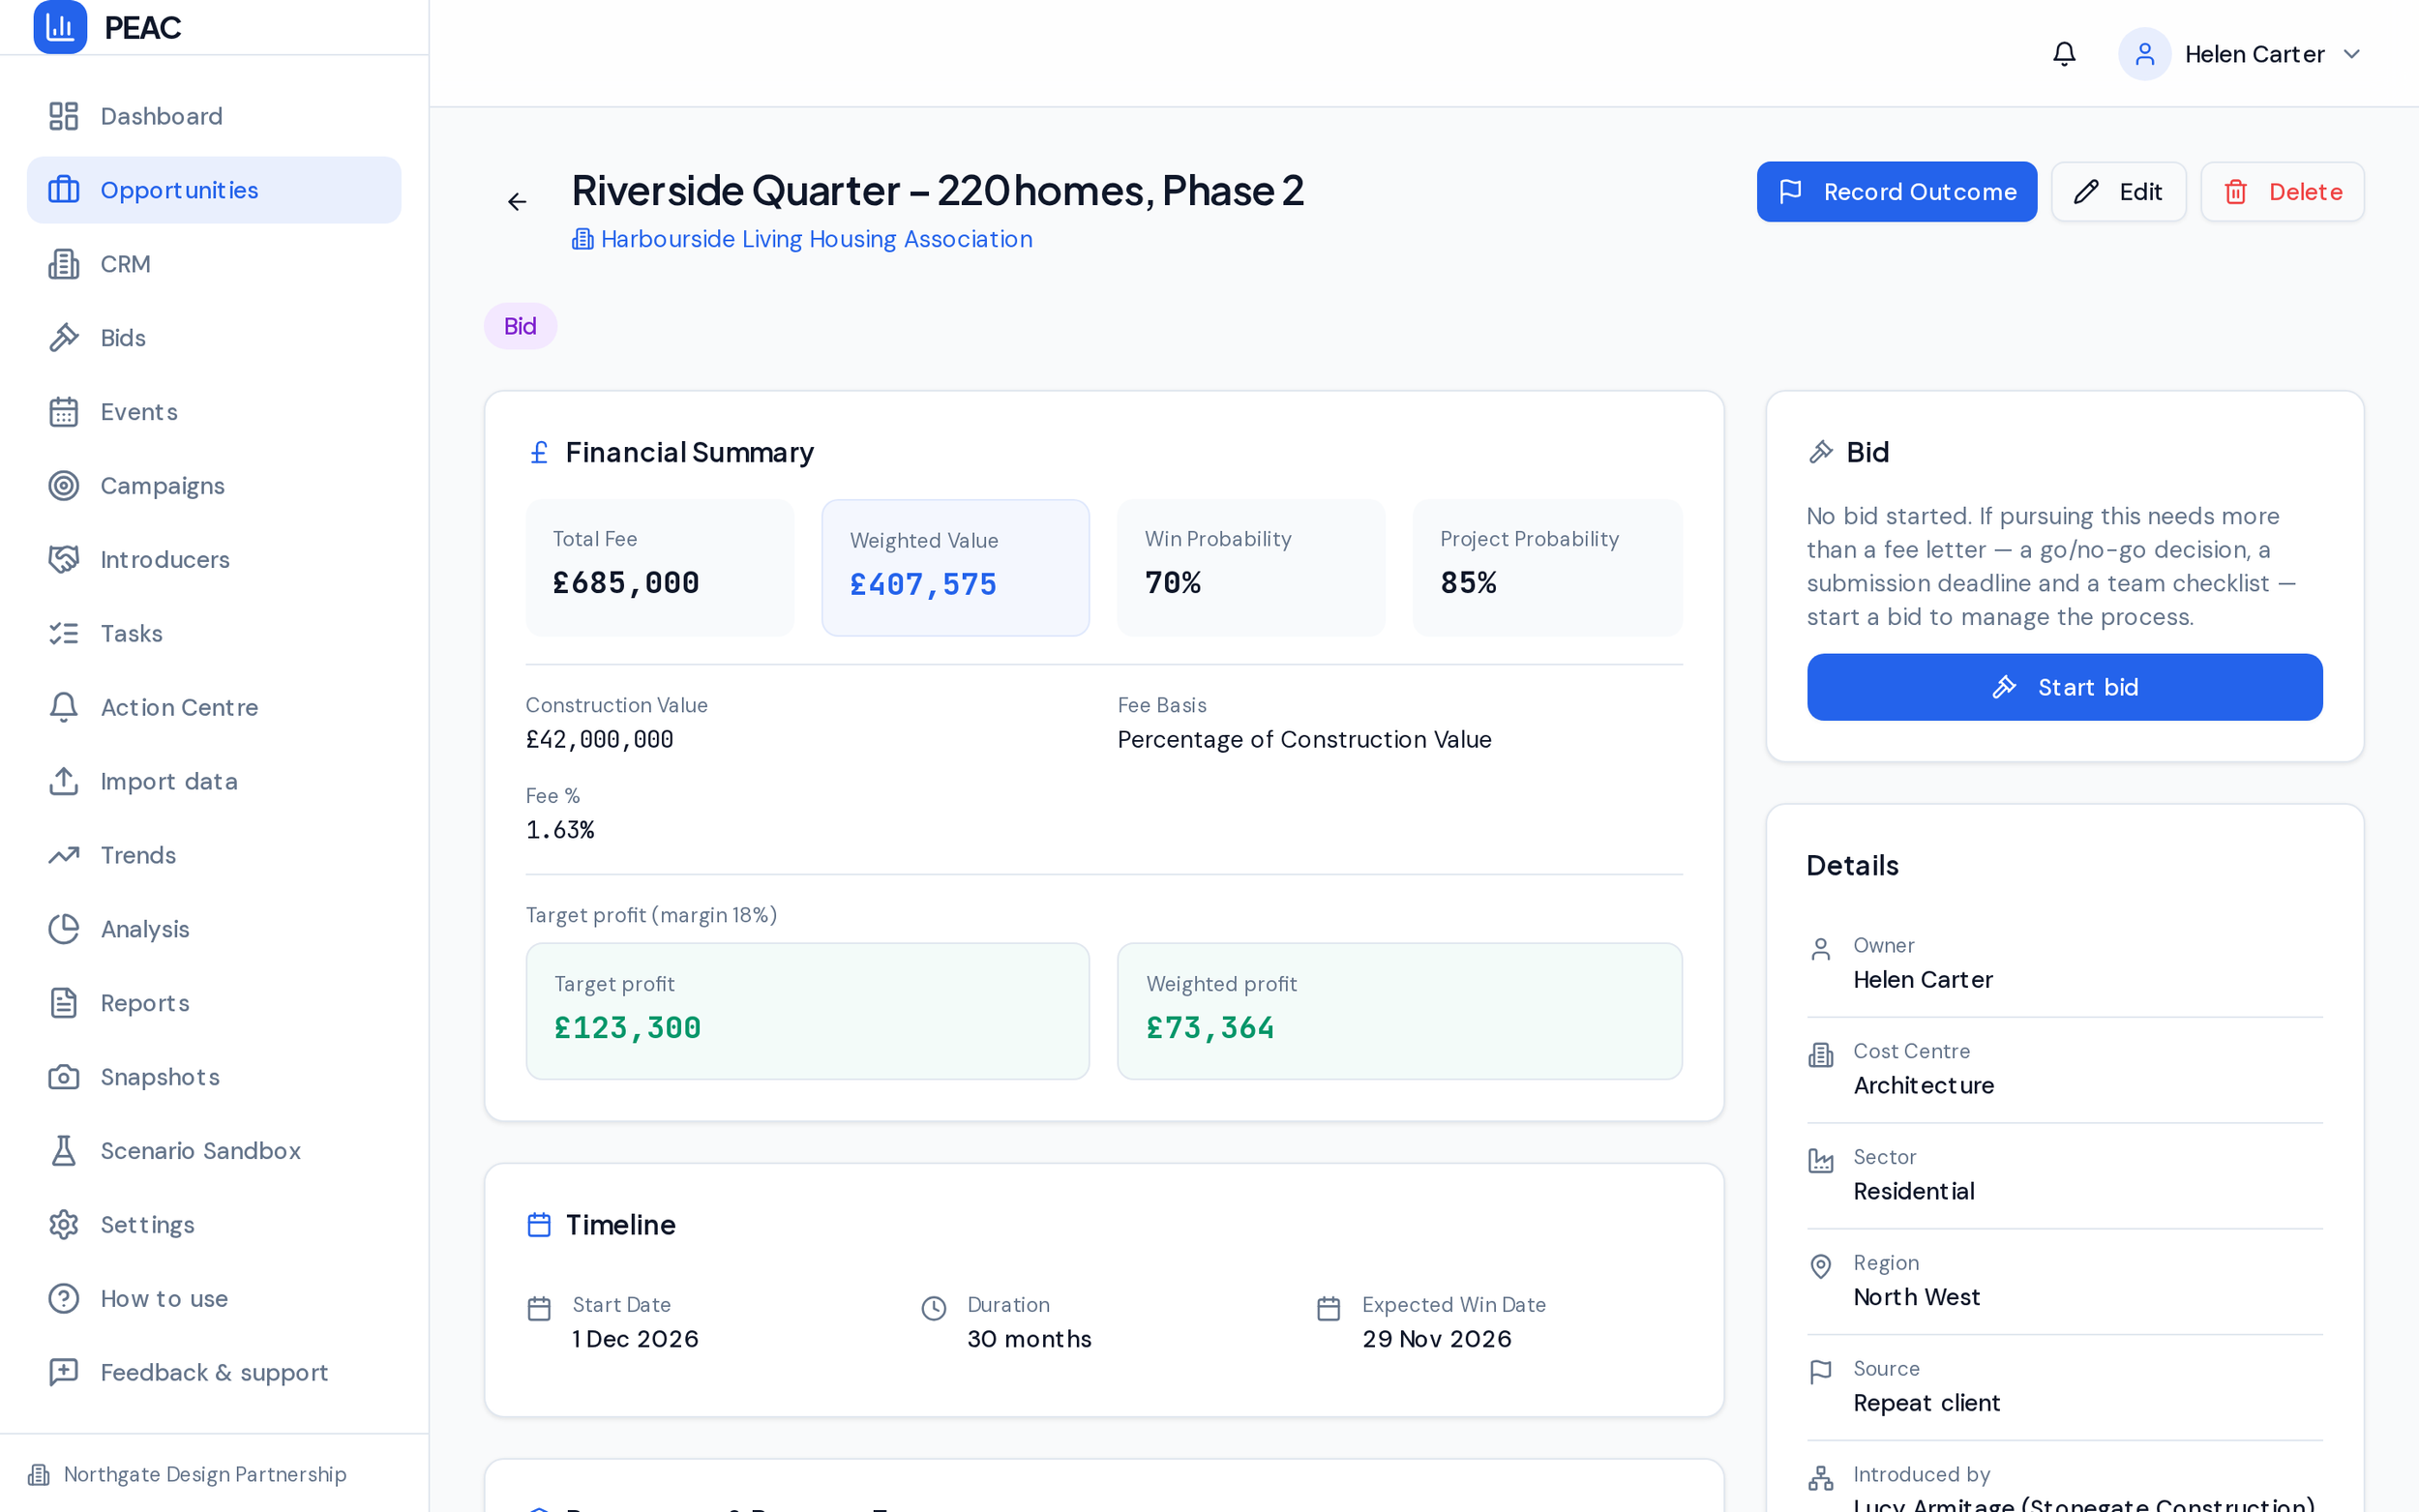
Log each opportunity with an overall fee, programme duration and starting date. Use the likelihood of winning the project and if the project itself is at risk, include that risk and let PEAC Studio calculate the future earnings. Select from one of the typical draw dawn patterns or create your own to suit the project and you have accurate forecasting.
Add your targets and secured income via import, and see the full picture of the business.
PEAC Studio’s engine will cast out the sum of all your opportunities across the business, allowing you to filter by cost centre, sector, opportunity stage, region - all in a live forecast, no need to constantly update or manually create copies on your desktop for analysis.
Export your raw or filtered data, allowing you to seamlessly integrate with your existing reporting structures and systems.
When a project is won, it moves to your current accounting tool to manage invoicing and draw down. No impact on your current financial procedures
Analyse your exposure in the Scenario Sandbox. Is a sector at risk of funding block from Government, is a project at risk of delay - test out the impact in a safe environment to judge your exposure. No need to manually zero individual lines in a spreadsheet.
Monitor trends over time. Are certain sectors achieving better success than others? Are some teams better at bidding than others? Are you relying on luck of the market, or are you winning work on price alone?
Review your success rates. Are there reasons for wins and losses on bids, what are the patterns telling you over time? Can this influence your approach going forward to reduce wasted effort on bids that are not winning.
Link each opportunity to the CRM module, tracking and monitoring against client, influencers and how the business development activity has won the project over time.
Receive automated reports and see how the pipeline and trends are looking over time. What patterns will you find?
Be alerted where project leads have gone stale with no activity. Delivery teams too busy to monitor and follow up, delegate to another senior team member.
Important project with a complex submission? Register it to go through the Bid module. Set tasks and key dates against the relevant team members to ensure a coordinated response
Read our White Paper
A strategic guide to replacing fragmented spreadsheets, eliminating relationship blind spots, establishing firm-wide commercial accountability, and forecasting revenue across multi-year project programmes. Written for every professional on the team (architects, engineers, project managers, cost consultants, acousticians and more), from small studios to national consultancies.